EngineSight — Fleet & Engine Performance Dashboard
Fleet Management System | Performance Analytics & Data Visualization | Shipped 2023
Project overview
Designed a comprehensive dashboard that helps fleet managers and engineers monitor performance, efficiency, and maintenance of their vehicles and engines. The system centralizes live metrics and key data points, improving operational visibility and decision-making.
FleetSense is a performance and analytics dashboard designed for monitoring fleets and engine systems. It provides a centralized space for viewing operational metrics, performance trends, and maintenance status in real time.
The aim was to help managers make faster, data-backed decisions by translating complex performance data into clear, actionable visuals.
Product
Web Application
My Role
Product Designer — UX Research, Dashboard Design, and Visual Systems
Skills
Information Architecture, Data Visualization, Prototyping, UI Design
Impact
Enabled unified visibility across fleets, reduced time to detect issues, and improved performance tracking accuracy
Introduction
Fleet operations rely on continuous data from vehicles and engines to maintain efficiency and uptime. However, existing tools often fragmented performance data, forcing users to switch between systems.
The FleetSense dashboard was created to unify this experience — bringing all critical insights together in a single, easy-to-navigate interface.
Problems & project goals
Fleet managers struggled with disconnected tools and delayed insights, making it difficult to monitor engine health and overall efficiency.
There was no single dashboard that summarized fleet performance and maintenance schedules in real time.
Goals: build a central, intuitive interface for tracking performance metrics, improve efficiency insights, and reduce cognitive load while interacting with data.
Opportunity
The dashboard provided an opportunity to transform scattered data into visual intelligence — giving fleet managers clarity on performance and maintenance trends.
With a structured information architecture and modular design, the system could scale to accommodate new metrics and fleet categories in the future.
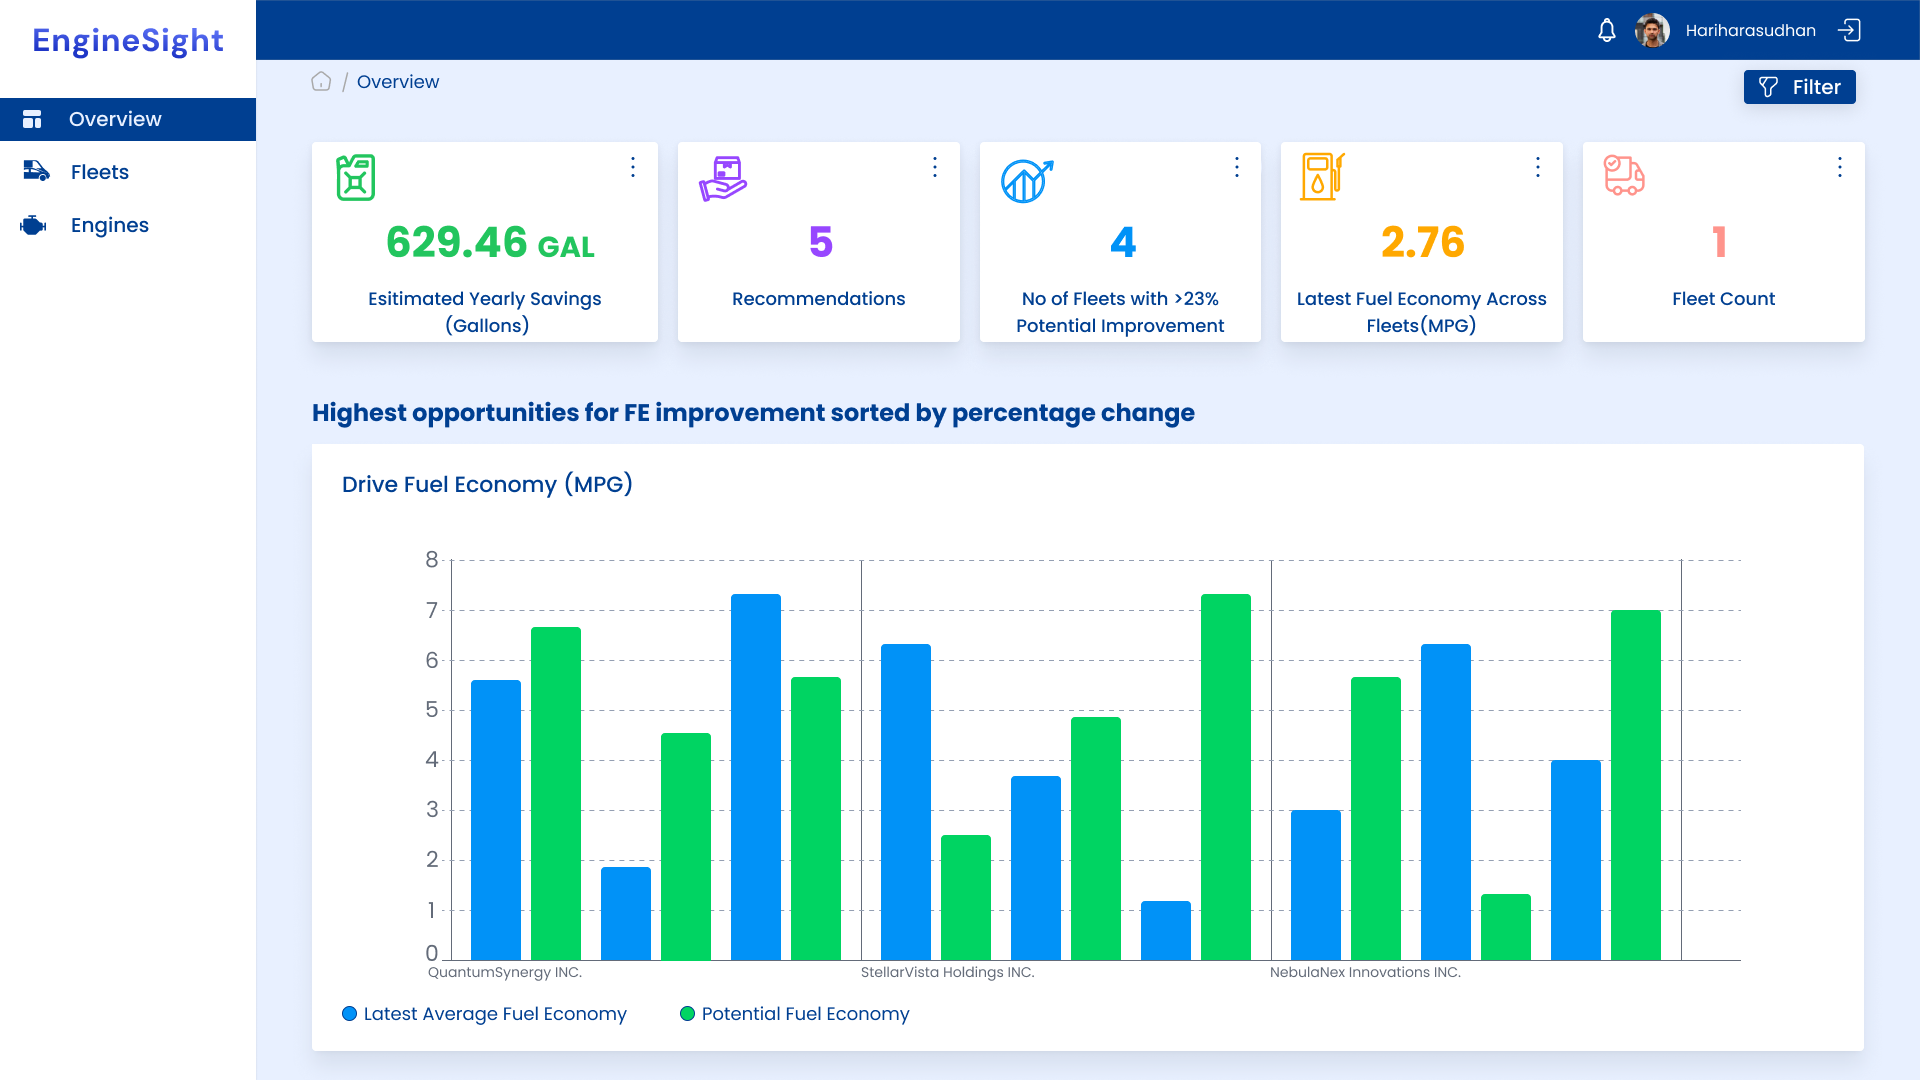
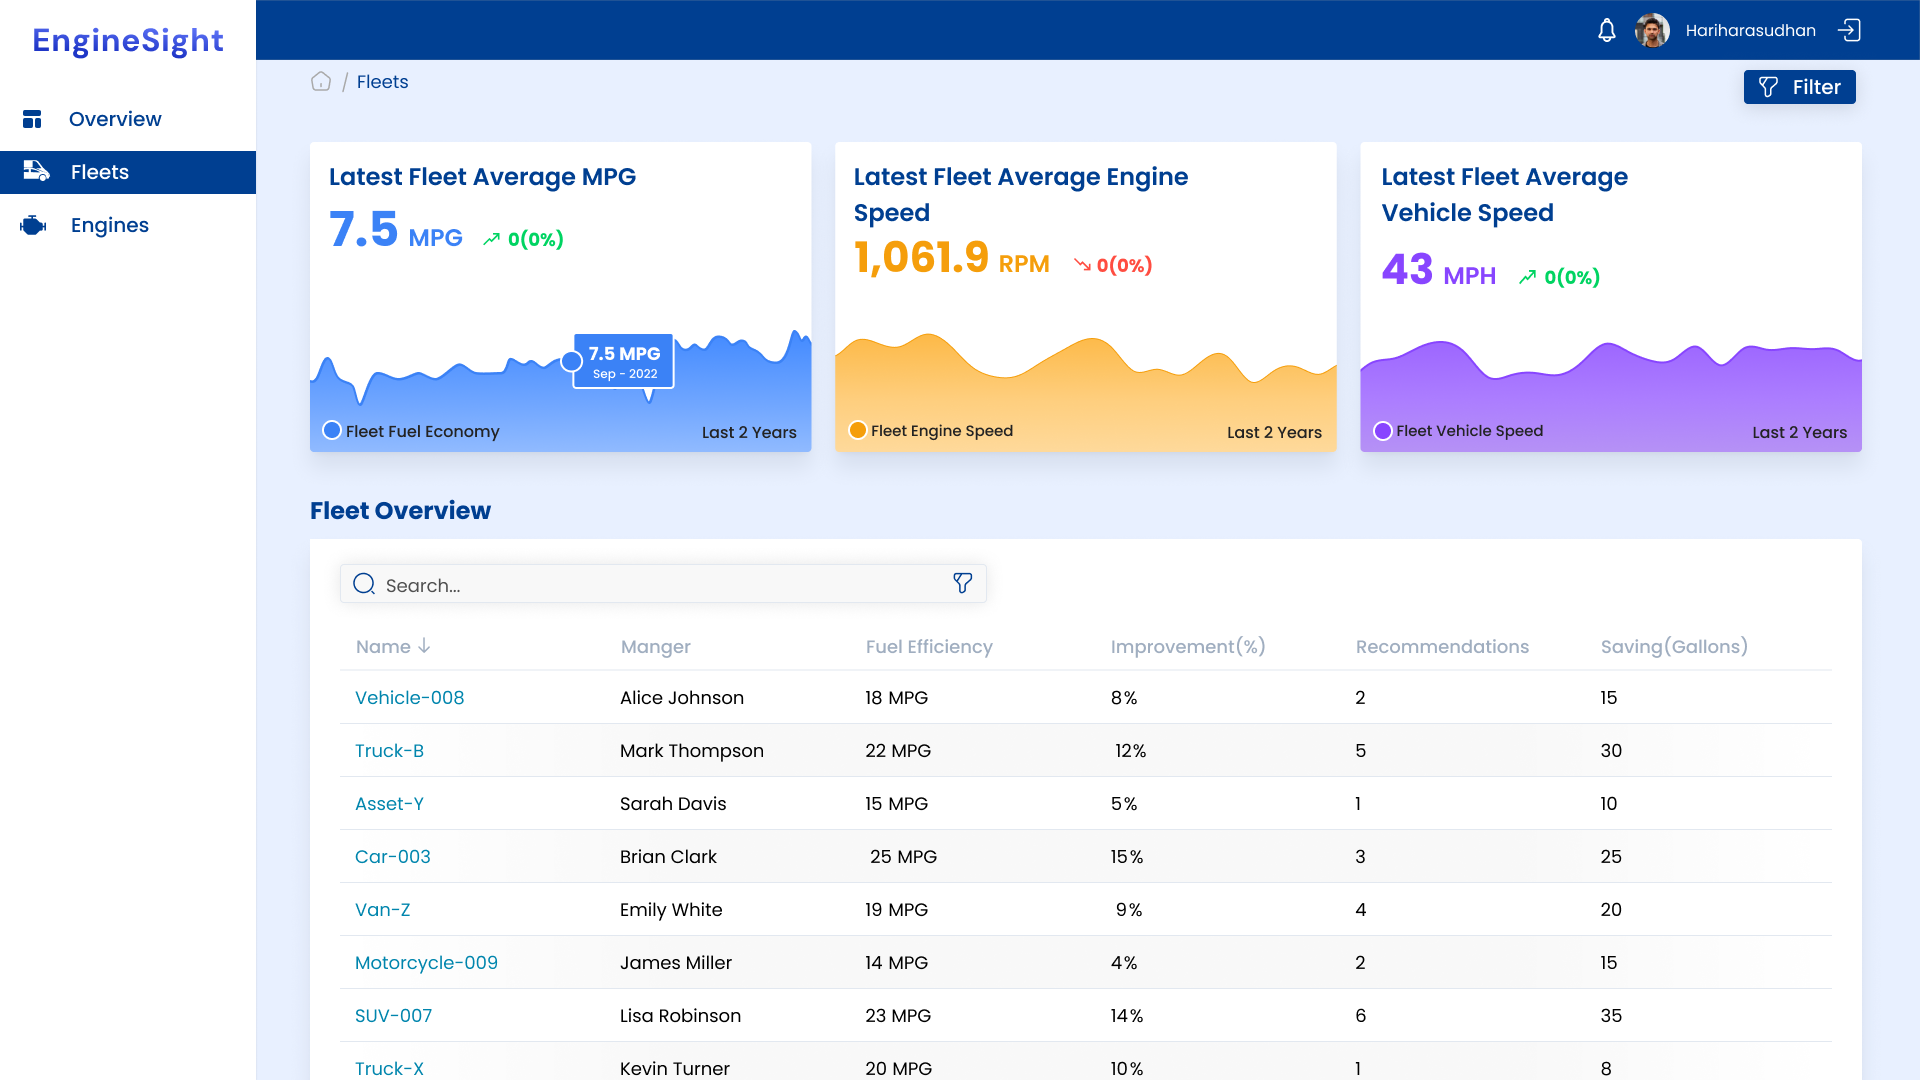
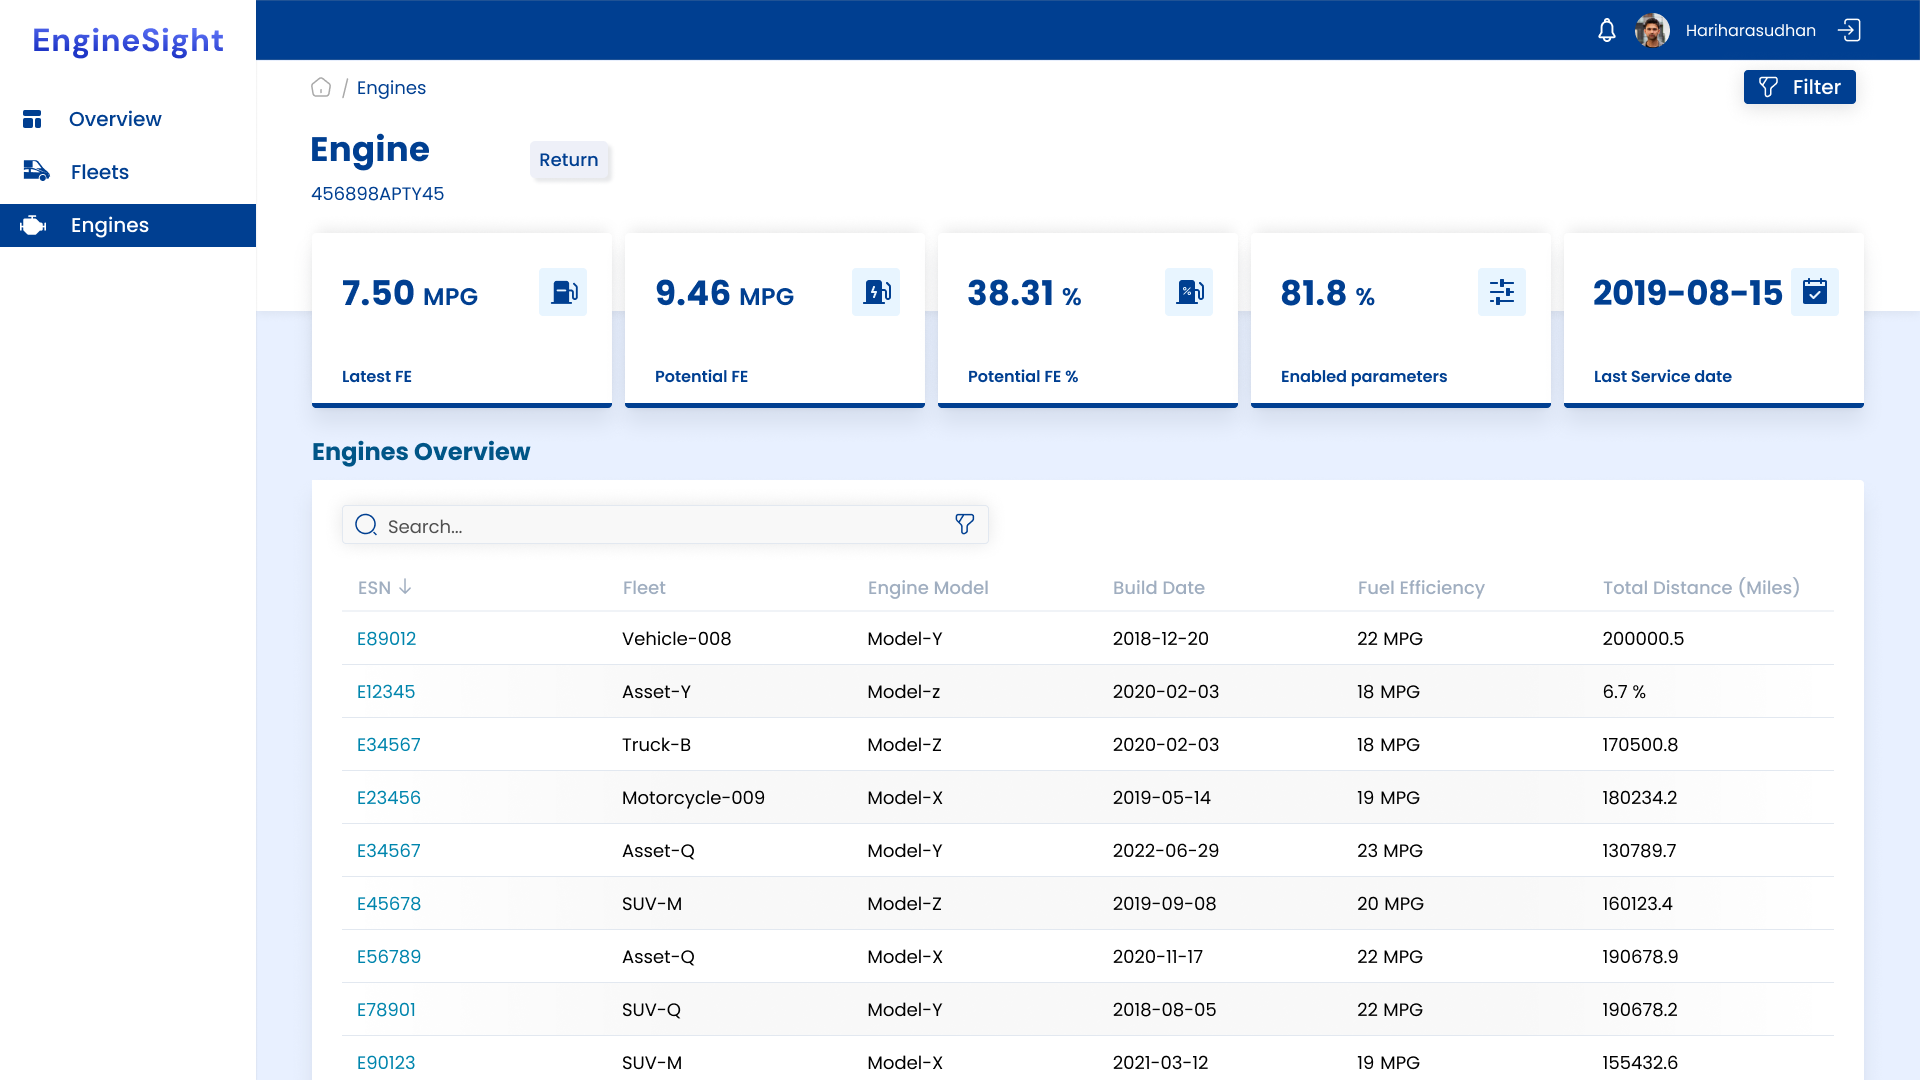
Final designs
The final dashboard design showcased clear performance indicators through KPI cards, trend charts, and fleet summaries.
Color-coded performance zones highlighted efficiency ranges, while a structured card layout ensured clarity without clutter.
Interactive components like filters and drill-down views allowed managers to focus on specific engines or time periods for deeper analysis.
Outcomes & impact
User testing revealed improved data comprehension and faster identification of underperforming engines.
Fleet teams reported a 25% reduction in time spent monitoring daily metrics.
The design helped standardize reporting visuals across departments, increasing operational transparency and trust in data.
Takeaways
Designing data-heavy dashboards requires balancing information richness with clarity.
Visual hierarchy, color cues, and modular components help simplify complex datasets.
FleetSense reinforced the value of designing with real operational contexts — where every second saved in decision-making impacts performance in the field.